This article is the second of a three-piece how to.
You can find the first part here
Ok ok, so if you are here it means that your Boss didn't agree to buy you a Splunk instance, right?
And after having accidentally trashed all his emails you decided to give ELK a try so yes, let's continue.
In the first part we installed a bunch of ports and started elasticsearch and logstash (bonus, they worked!).
We installed kibana as well, right? So time to configure it:
cat > /usr/local/etc/kibana.yml << EOF
server.port: 5602
server.host: "127.0.0.1"
elasticsearch.url: "http://127.0.0.1:9100"
logging.quiet: true
EOF
and to start it:
root@elk:~ # service kibana start
I guess your friends will be highly disappointed by the fact that you are restricting your kibana instance to 127.0.0.1, right? Oh sorry, I forgot you don't have any friends but well, just in case, it's better to create a vhost in our NGINX configuration (i.e. http://kibana.foo.bar):
server {
  server_name kibana.foo.bar;
  listen 80;
  proxy_set_header Host             $host;
  proxy_set_header X-Real-IP        $remote_addr;
  proxy_set_header X-Forwarded-For  $proxy_add_x_forwarded_for;
  proxy_set_header Upgrade $http_upgrade;
  proxy_set_header Connection "upgrade";
  proxy_set_header Cookie "";

  location / {
    auth_basic "Stay angry, stay foolish, stay out!";
    auth_basic_user_file "/usr/local/etc/nginx/kibana.passwd.file";
    proxy_pass http://127.0.0.1:5602;
    proxy_http_version 1.1;
  }
}
Why auth_basic? Well, basically because I don't trust anyone (but this is another story) and because kibana has no auth mechanism, so a good-old fashioned auth_basic came to the rescue.
Pointing your preferred browser to http://kibana.foo.bar you should see something like this:
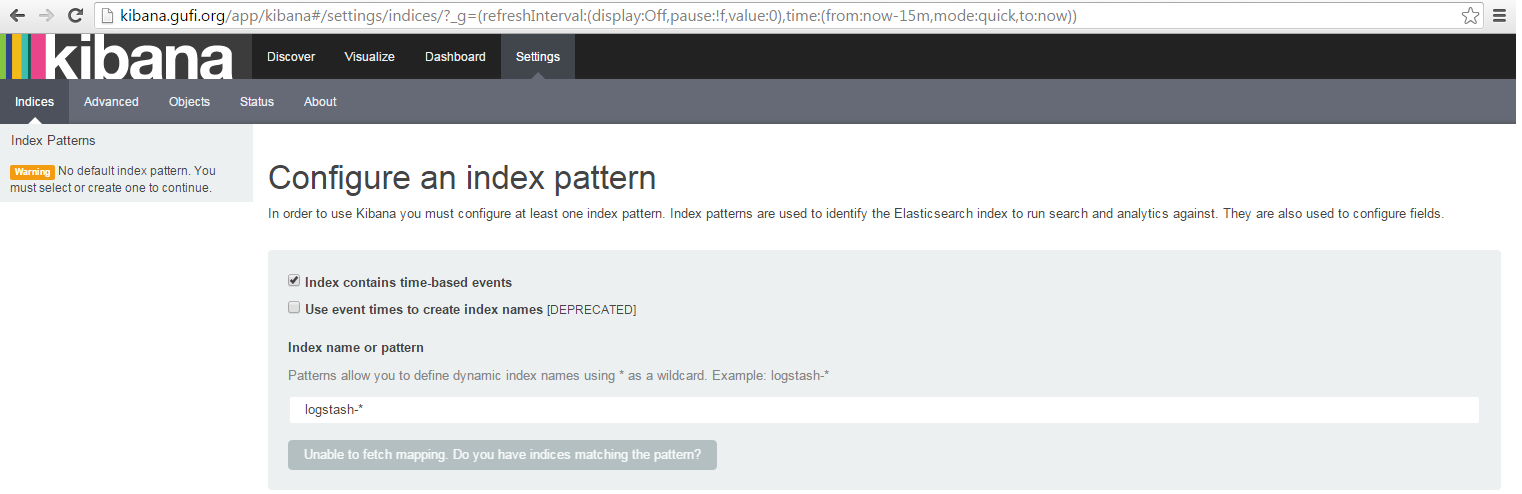
Well, nothing fancy right? And a grey button with Unable to fetch mapping blablabla and that's it? No wait, are you switching to Ubuntu?
Please don't, this is normal: basically kibana doesn't find any event and so doesn't know what to show and how to show it.
So before enjoing our brand new kibana instance we need to push data to elasticsearch.
I think that we can use our ELK stack not for our (boring) myapp, but for a more interesting NGINX access log.
Make sure we have something like this in our /usr/local/etc/nginx.conf:
log_format upstream '$remote_addr - $host [$time_local] "$request" $status $body_bytes_sent "$http_referer"'
                    '"$http_user_agent" "$http_x_forwarded_for" [$upstream_addr] "$upstream_cache_status"'
                    '"$upstream_response_time" "$request_time"';
- may I suggest to reload nginx (with service nginx configtest && service nginx reload)?
In /usr/local/etc/logstash/logstash.conf we should have:
filter {
  if [type] == "myapp" {
    grok {
      match => { message => "%{TIME:event_time} %{DATA:process}:%{GREEDYDATA:message}" }
    }
  }
}
Let's modify that with this:
filter {
  if [type] == "myapp" {
    grok {
      match => { message => "%{TIME:event_time} %{DATA:process}:%{GREEDYDATA:message}" }
    }
  }
  if [type] == "nginx" {
    grok {
      match => { message => "%{IPORHOST:remote_addr} - %{IPORHOST:host} \[%{HTTPDATE:time_local}\] "%{WORD:request_verb} %{URIPATHPARAM:request_url} HTTP/%{NUMBER:request_httpversion}" %{NUMBER:status} (?:%{NUMBER:bytes}|-) "(?:%{URI:referrer}|-)" %{QS:agent} %{QS:xforwardedfor} \[(?:%{NOTSPACE:upstream_addr}|-)\] "(?:%{WORD:upstream_cache_status}|-)" "(?:%{NUMBER:cache_response_time}|-)" "(?:%{NUMBER:request_time}|-)"" }
    }
  }
}
- May I suggest to restart logstash, sir?
So we are teaching logstash how to recognize our nginx events mapping them with fields.
How to learn to map real life events to logstash grok filters? Well, you have different choices:
- using /dev/random > /usr/local/etc/logstash/logstash.conf
- using google
- scrolling down
The smarter (and faster) way to do this is using: http://grokdebug.herokuapp.com/ with real events (aka: tail from your nginx access log file).
Is everything still fine? Damn, this is quite boring isn't it?
So, a quick recap:
NGINX is saving logs to (i.e.) /var/log/nginx/nginx.access.log, logstash knows how to decompose nginx access log events and where to save them so what are we missing? Right, a beer.
Well, actually we are missing something that monitors /var/log/nginx/nginx.access.log and that, in case of new events, sends deltas of it to a remote endpoint (basically something like splunk-forwarder).
For our purposes we'll use something called logstash-forwarder-java.
I know, I know: it's not in our ports, but feel free to use the one with have in our ports (the one Golang based), I'll continue using the java-based one (we have already installed java, dude).
# We'll install logstash-forwarder-java in /usr/local/logstash-forwarder
# So let's create a new tmux panel and start the dance!

sudo su -l
mkdir -p /usr/local/logstash-forwarder
cd /usr/local/logstash-forwarder
fetch https://github.com/didfet/logstash-forwarder-java/releases/download/0.2.3/logstash-forwarder-java-0.2.3-bin.tar.gz
tar zxf logstash-forwarder-java-0.2.3-bin.tar.gz
mkdir /usr/local/logstash-forwarder/etc
cat > /usr/local/logstash-forwarder/etc/logstash-forwarder.json <<EOF
{
  "network": {
    "servers": [ "127.0.0.1:4433" ],
    "ssl ca": "/usr/local/etc/logstash/keystore.jks",
    "timeout": 15
  },
  "files": [
    {
      "paths": [ "/var/log/nginx/nginx.access.log" ],
      "fields": { "type": "nginx" }
    }
  ]
}
EOF

mkdir /usr/local/logstash-forwarder/bin
cat > /usr/local/logstash-forwarder/bin/start.sh << EOF
#!/bin/sh

LF_PATH="/usr/local/logstash-forwarder"
LF_VER="0.2.3"
LF_NAME="logstash-forwarder-java-\${LF_VER}"

/usr/local/bin/java -jar \${LF_PATH}/\${LF_NAME}/\${LF_NAME}.jar -config \${LF_PATH}/etc/logstash-forwarder.json

exit 0
EOF

/usr/local/logstash-forwarder/bin/start.sh
Whoa, now you should see something like:
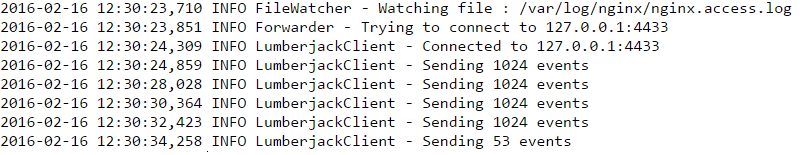
meaning that logstash-forwarder is working and it's sending events to logstash (using the lumberjack protocol).
Fire up http://kibana.foo.bar, we should see something like:
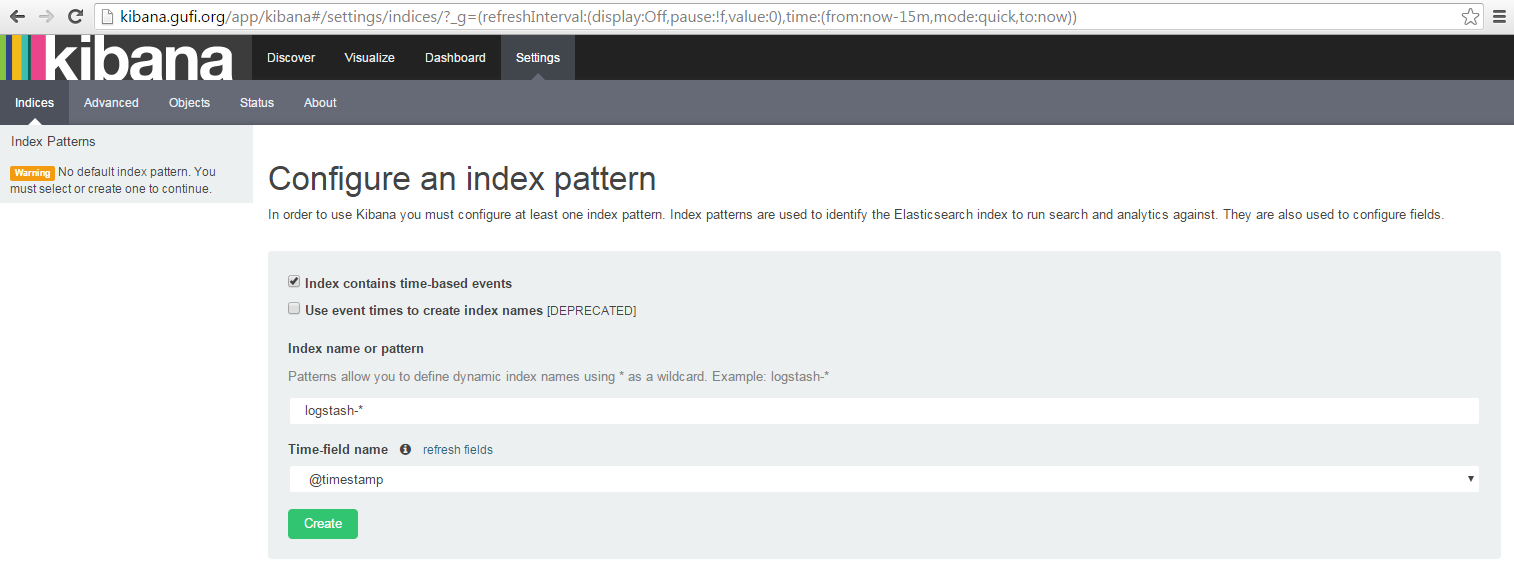
Finally, a green button that I can click on! (yes, you should actually click on it).
Now, let's go in the Discovery Tab and you should see something like:
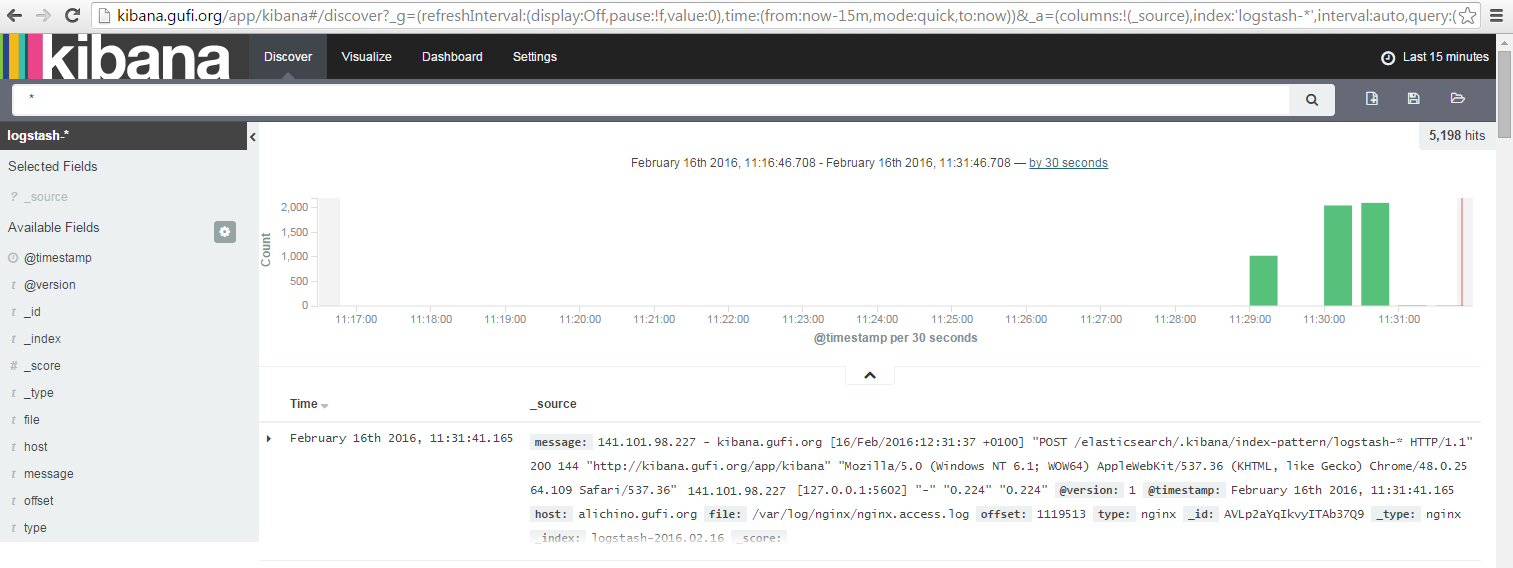
Yes, it's time to create screenshots for friends (and for twitter and reddit, oh social life!)
Ok, now that the entire world knows that you are following a tutorial, let's continue.
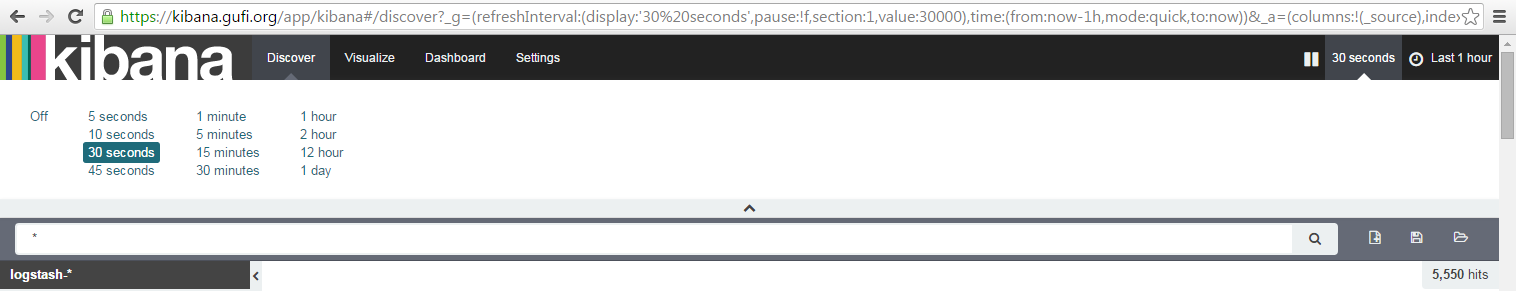
One thing you should absolutely do in kibana is to set autorefresh to some value (it's Off by default), like 1m:
and the time window interval to something like 1h to have events related to a 1h moving window:
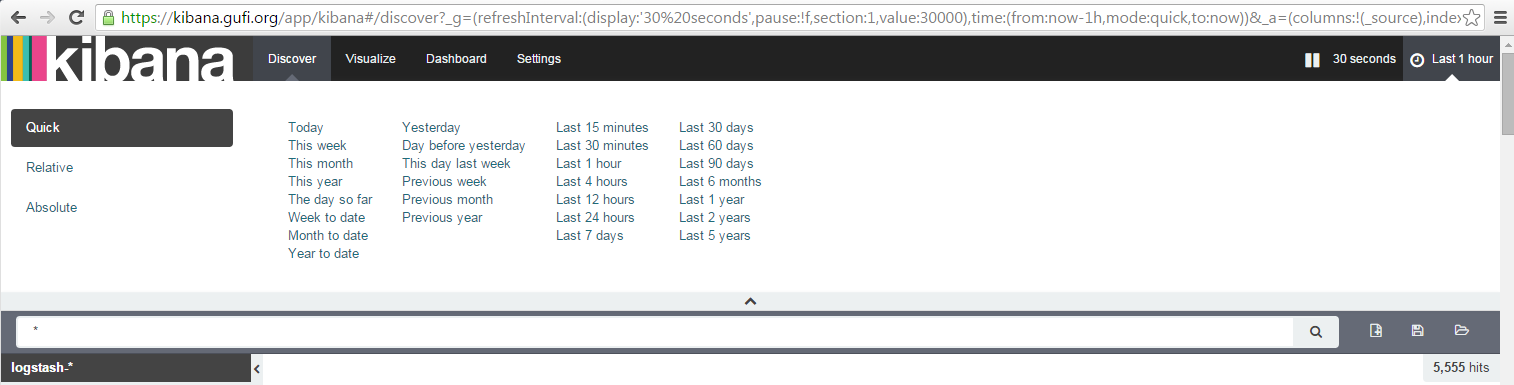
Good, let's move on.
On the left side you see a list of fields:
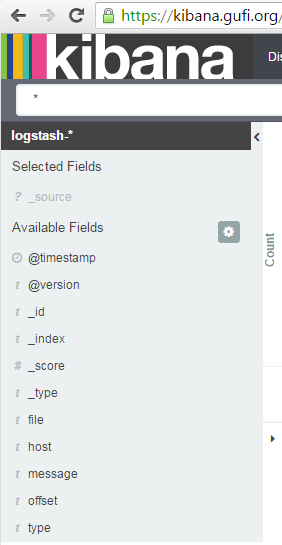
so our events are mapped like:
Well, it' ok-ish: I see really few fields I can search/aggregate on (host, _type) and a big blog called message. I can search, yes but what if I'd like to see event logs related to http/404?
We defined our nginx grok filter to inspect this big message blob and to decompose it in field:value pairs. So, let's use them!
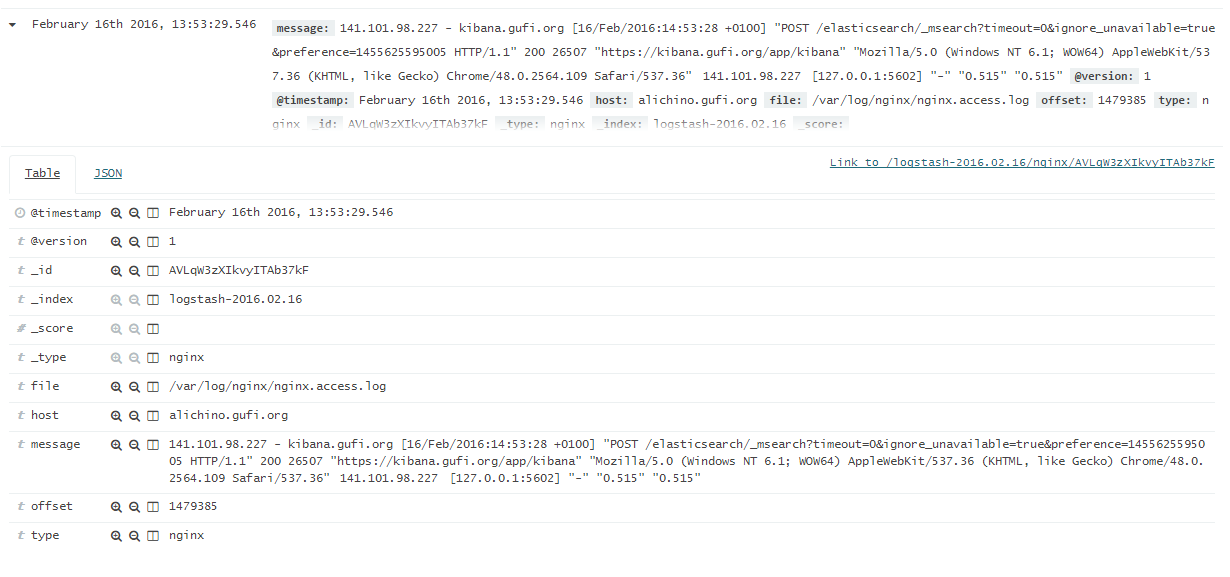
Back on Kibana -> Settings -> Click on 'logstash-*' index on your left -> Click on the 'refresh field list' button Then you should see something like:
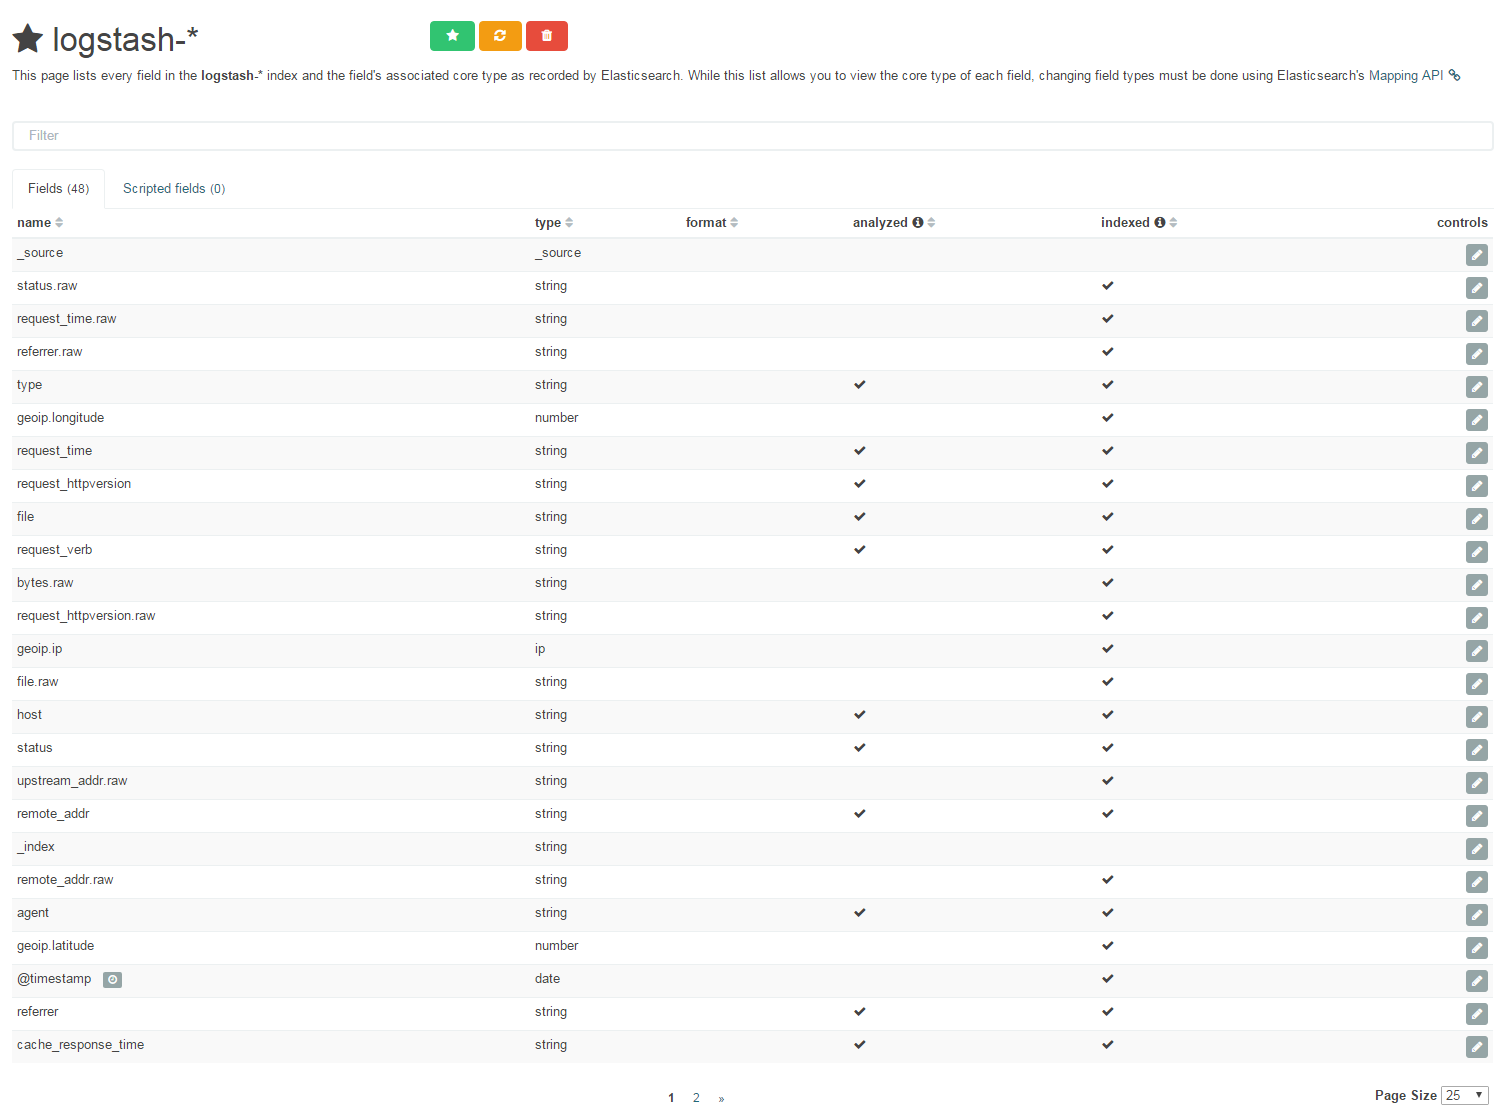
and you should now see fields as we defined them in logstash grok filter (nginx section): searching nginx error http/404 is really simple now (don't worry, I'm not leaving this to you).
For example, let's see how to display all nginx logs related to GET requests with a response_status of 200 (aka pages served successfully):
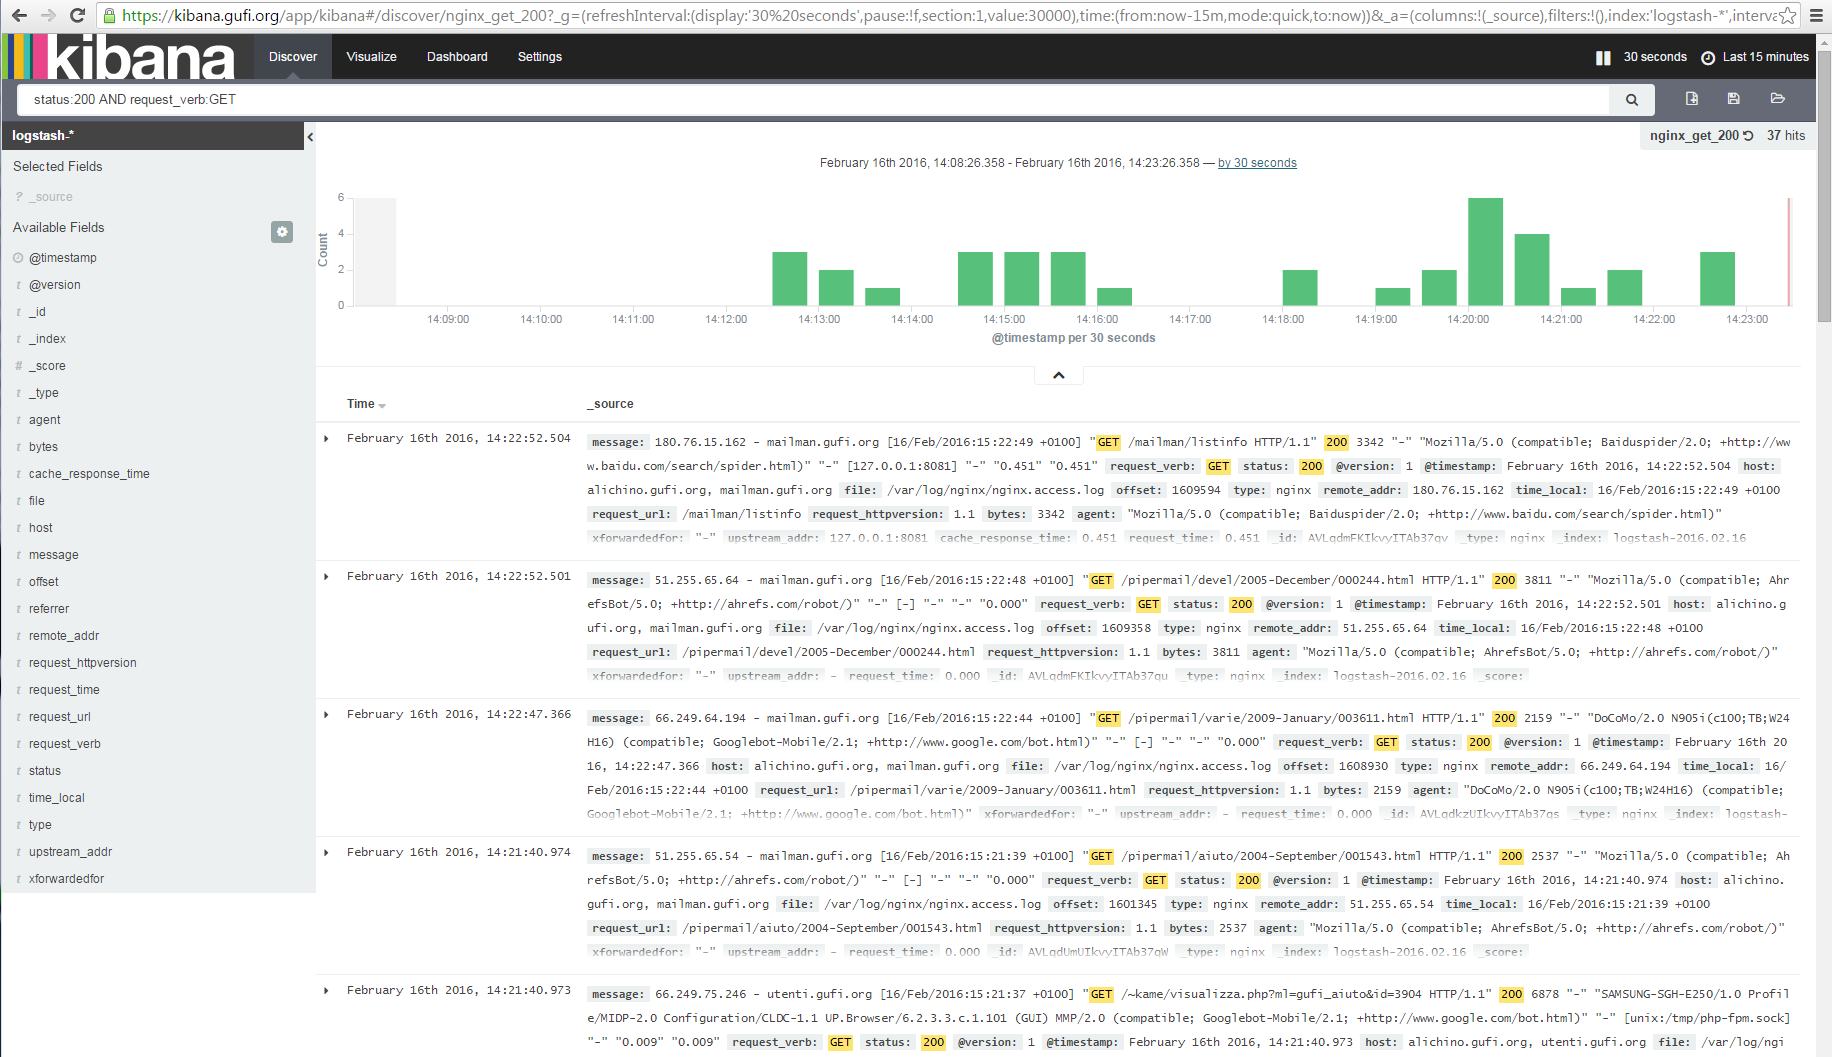
Told'ya it was simple, dud! (Gangsta, isn't it?)
Let's call this search nginx_200_search and save it (Using the Save Search button) then move to the Visualize Tab to...
CREATE A NEW VISUALIZATION (because everybody loves graphs!)
In this case we'll use a Line chart -> From a saved search -> nginx_200_search
As bucket we'll use X-Axis -> Aggregation -> Date Histogram
In Options we can choose Smooth Lines then we can click on the Play button: if you were not busy watching a Netflix movie, you should see something like this:
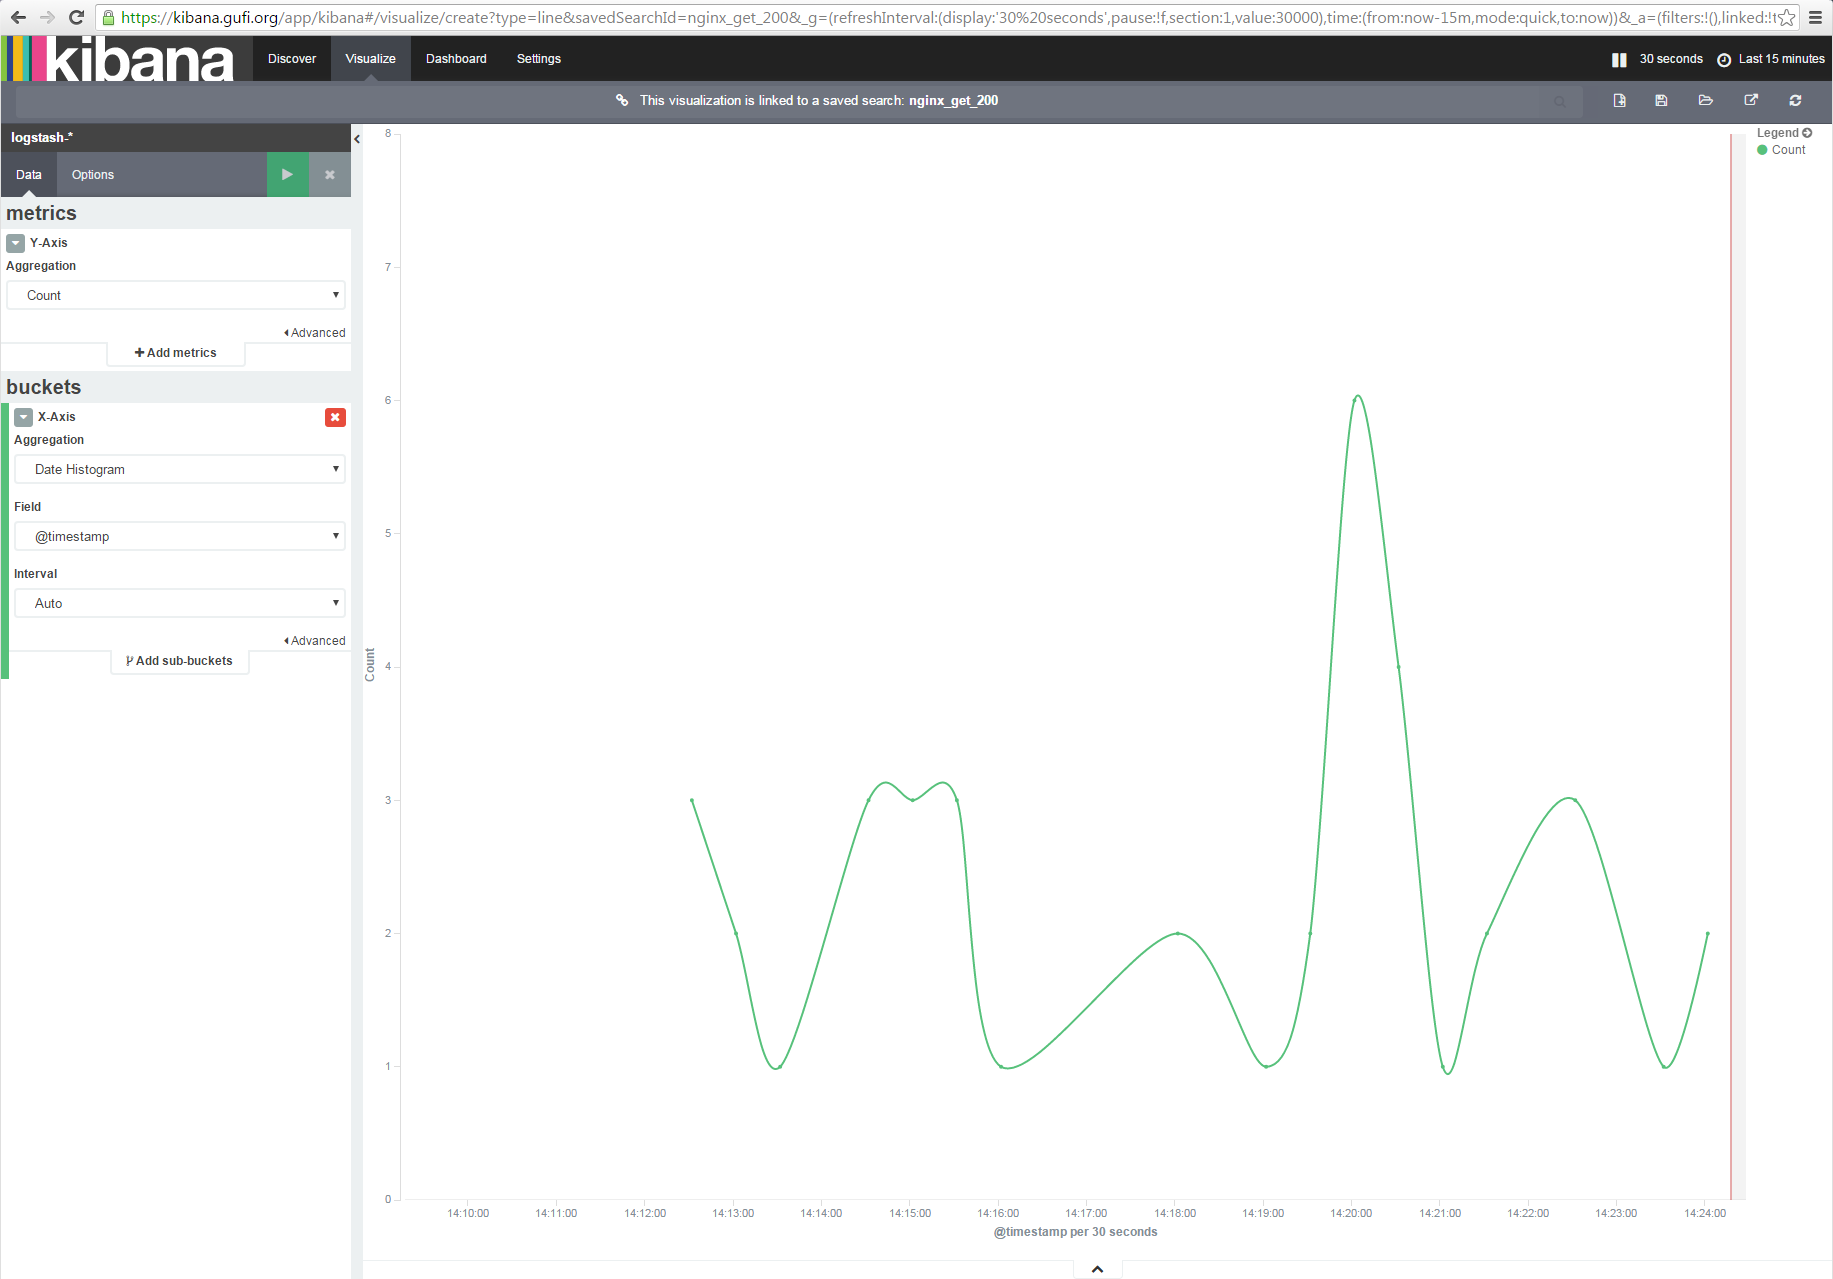
Nice, isn't it?
Save this graph as nginx_200_graph and move to the Dashboard tab.
Here, using the '+' button you can add already saved graphs to have a fancy (and useful) dashboard created starting from your logs, like this:
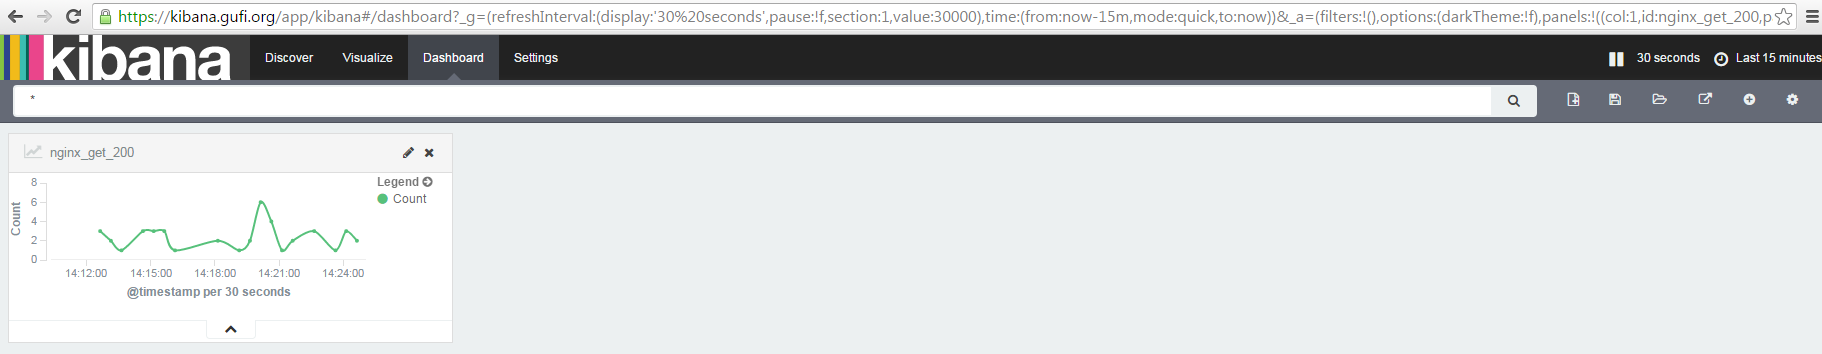
How great is it, man!
In the next article we'll focus on ElastAlert, aka creating alerts based on our logs (and if I'll have space, I'll talk about myself. Maybe a little. Ok, I won't).